See the related posts on RExcel (for basic, Excel 2003 and Excel 2007) for basic information.
We already discussed in previous posts that how to install RExcel to how to load a data.
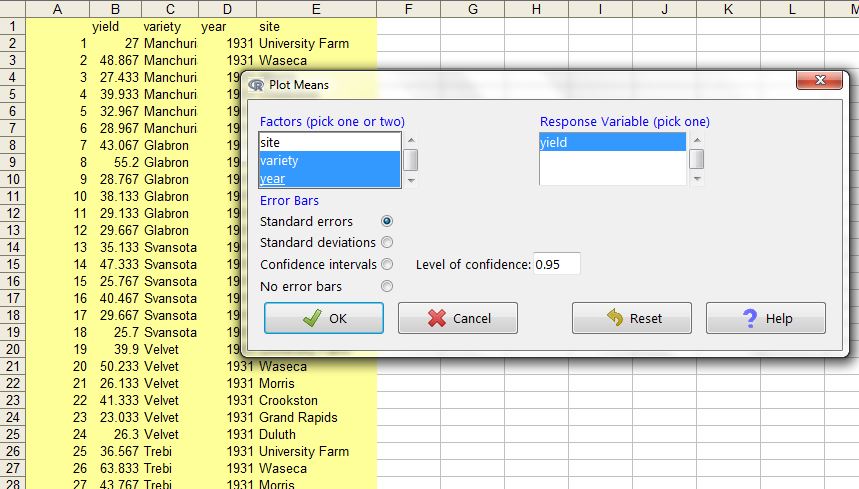
Let's get a data, here I am loading barley data from R/lattice library. The data is in the long form (unlike many datasets in Excel), data with many treatments or replications or samples are arranged this way. Calculating means, standard errors etc is difficults. RExcel can quickly do for you and generate publication ready graphs.
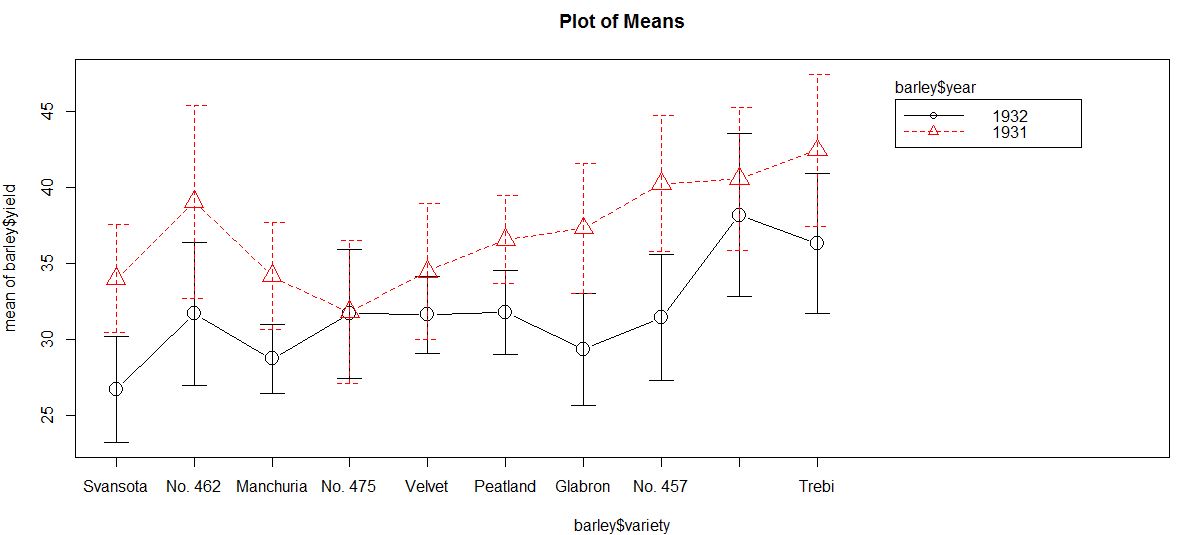
We can select one or two factors and one numeric response variable.
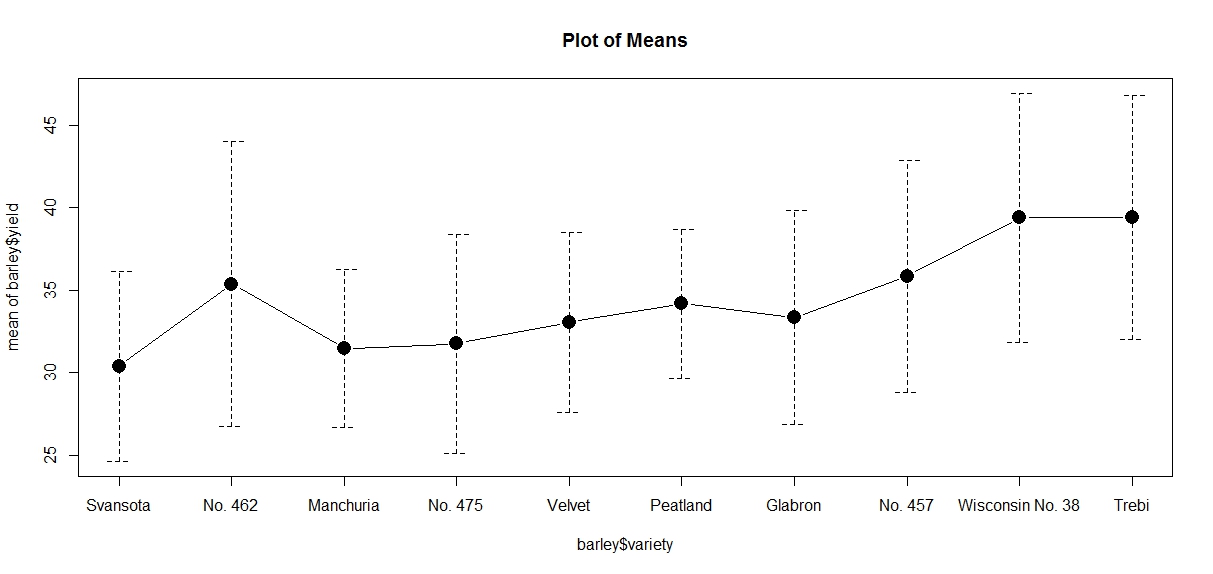
Mean by single factor variety.
We already discussed in previous posts that how to install RExcel to how to load a data.
Let's get a data, here I am loading barley data from R/lattice library. The data is in the long form (unlike many datasets in Excel), data with many treatments or replications or samples are arranged this way. Calculating means, standard errors etc is difficults. RExcel can quickly do for you and generate publication ready graphs.
We can select one or two factors and one numeric response variable.
Mean by single factor variety.
No comments:
Post a Comment