For plotting equation we need X and Y, thus Y is function of X.
We need two things to specify:
(1) Bin of estimate - if bin of estimate is low will produce nice and smoother line.
(1) X and Y limit, this depends upon the equations and the portion of the curve you want to see.
Examples:
X^2 *Y^2 =1
By solving the quation, we get:
X = (1/Y^2)^-2
Please note operators in Excel:
Also order of operation is Brackets, Exponents, Division, Multiplication, Addition, Subtraction.
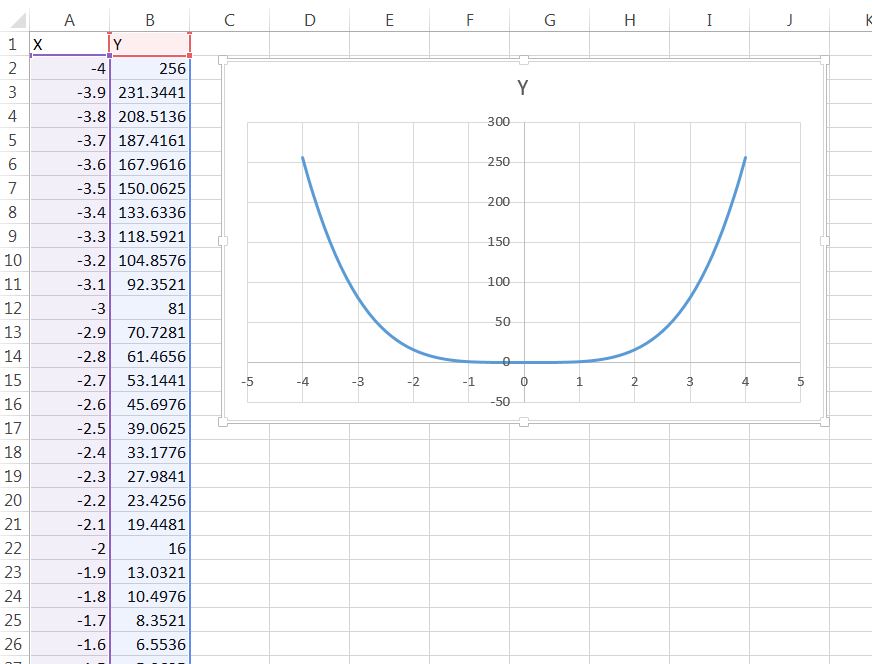
Let's calculate values creating formula in Excel:
The formula for the first cell becomes:
=(1/(A2^2))^-2
Here the bin is set to 0.1 and range of X values from -4 to -4.
Data series ready, just plot scatter plot with smoothed line:

We need two things to specify:
(1) Bin of estimate - if bin of estimate is low will produce nice and smoother line.
(1) X and Y limit, this depends upon the equations and the portion of the curve you want to see.
Examples:
X^2 *Y^2 =1
By solving the quation, we get:
X = (1/Y^2)^-2
Please note operators in Excel:
Subtraction - minus sign ( - )
Addition - plus sign ( + )
Division - forward slash ( / )
Multiplication - asterisk (* )
Exponentiation - caret (^ )
Also order of operation is Brackets, Exponents, Division, Multiplication, Addition, Subtraction.
Let's calculate values creating formula in Excel:
The formula for the first cell becomes:
=(1/(A2^2))^-2
Here the bin is set to 0.1 and range of X values from -4 to -4.
Data series ready, just plot scatter plot with smoothed line:
We can add other formulas to the plot, just by adding the series. To do so we need to repeate calculation at certain bin interval.
Plotting a circle:
(x-4)2 + (y-2)2 = 25
We need to plot two equations:
2+sqrt(25-(x-4)^2)
2-sqrt(25-(x-4)^2)
Between range of -1 to 9, create X bins and calculate the values.
Similarly we can plot any equation or density functions.
No comments:
Post a Comment