See the related posts on RExcel (for basic, Excel 2003 and Excel 2007) for basic information.
We discussed how we can use RExcel in previous posts. By implementing RExcel we can perform cluster analysis and generate Dendogram plots.
(1) First load R and then R commander to see R menu in Excel (see previous posts)
(2) Following example uses dataset CO2 from the R dataset library. Load the data.
In statstics menu click Fit models and then linear regression.
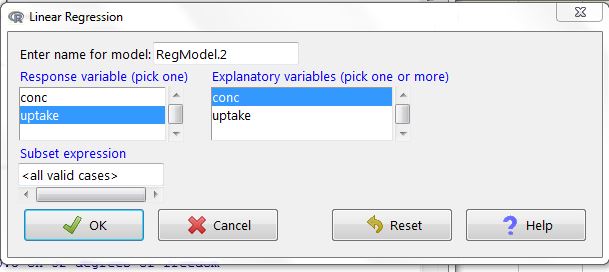
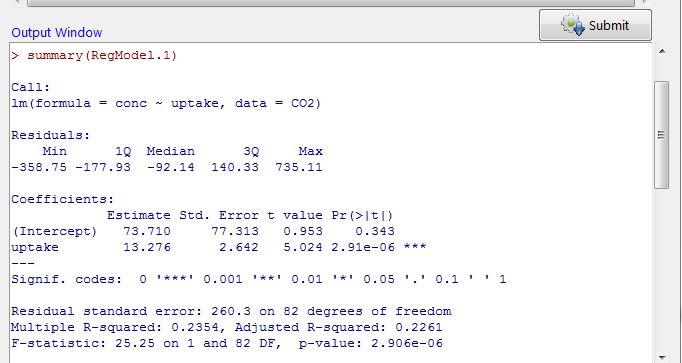
Now we have to select one respnse variable and explanatory variables (one or more). Click OK will produce a regression model results (see outout window):


Happy plotting !!
We discussed how we can use RExcel in previous posts. By implementing RExcel we can perform cluster analysis and generate Dendogram plots.
(1) First load R and then R commander to see R menu in Excel (see previous posts)
(2) Following example uses dataset CO2 from the R dataset library. Load the data.
In statstics menu click Fit models and then linear regression.
Now we have to select one respnse variable and explanatory variables (one or more). Click OK will produce a regression model results (see outout window):
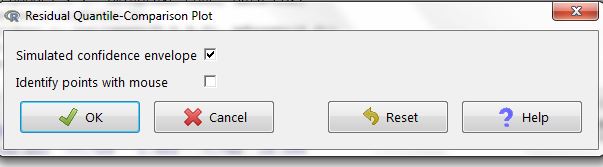
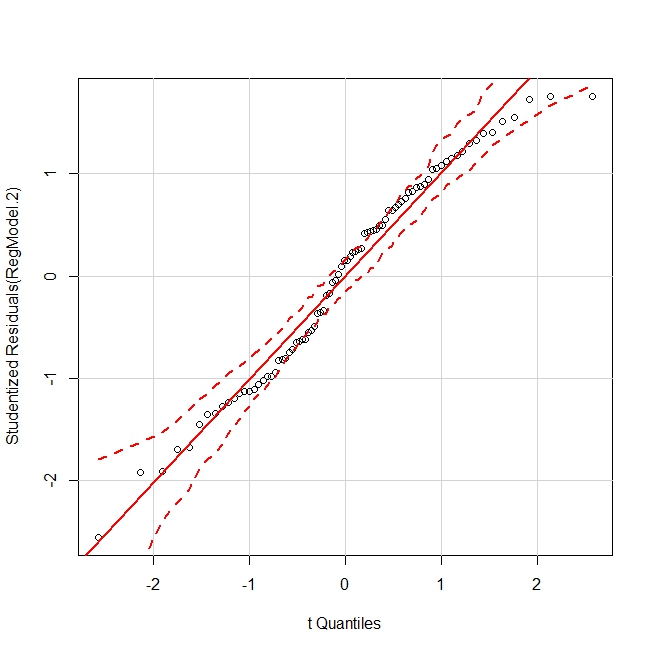
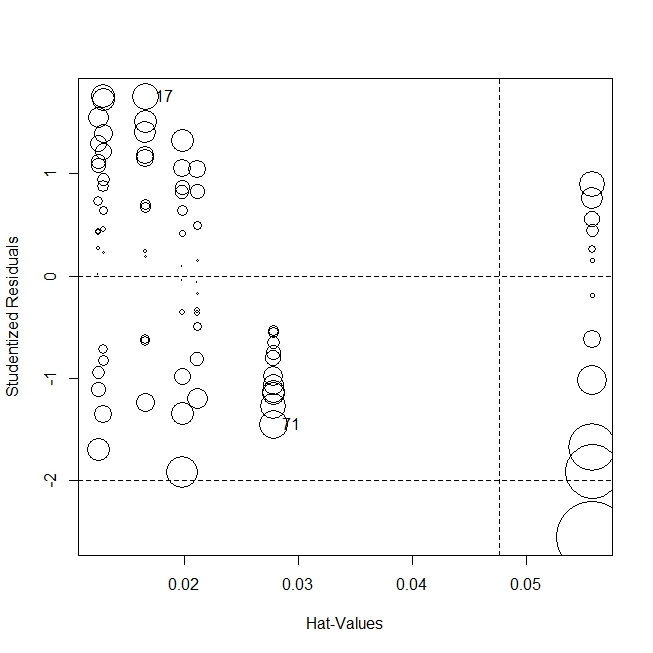
Now we can plot the model. Click to models menu and then graphs select basic dignostic plots. You can see residual vs fitted, Normal Q-Q, Scale-Location, residual vs liverage plots.
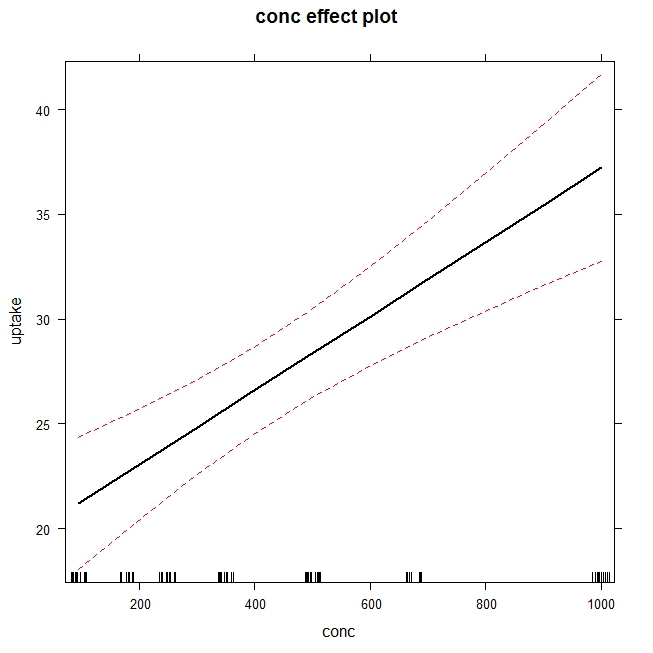
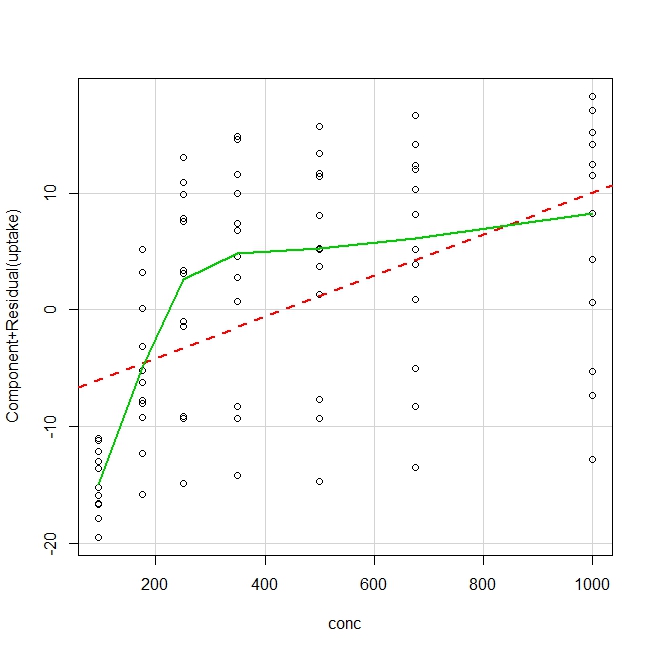
Similarly other regression plots are available unders models -> graphs and type of plot.
Similarly other plots available, just play around !
Happy plotting !!
No comments:
Post a Comment